


Photo by Maxim Hopman on Unsplash
Crypto Market Analysis - Is the Market random or is there a favourable Side - Ripple (XRP)?


This series deals with the question if the crypto markets follow the random-walk theory, or if the markets have a favourable side. More specifically we look at the data to find out, if there is a favourable side of the market i.e. if it is favourable to be on the long/short side for different cryptocurrencies. The analysis focuses on daily price data and we just look at the relation of up-/down-close candles.
The cryptocurrency I focus on in this article is Ripple (XRP). Be wary to take this analysis with a grain of salt, as the data available might not be enough to extract actual valid information from the data. Further this must not be seen as financial advice.
Data Acquisition
Equally to the previous articles in this series I again used the Gate.io Exchange API to query the price data. See this article to find out more about how to get the price data and which exchanges are supported by the ccxt library. For XRP, price data is available all the way back to May 19th 2017. This means on the day this analysis is based (August 1st 2022), we have 1901 days of data available (May 19th 2017 - August 1st 2022).
Findings
Again the structure of the Findings section is equal to the recent articles of this series, with the section being split into:
- Split of Up, Down and Equal Days
- Probabilities of an up-/down-close day following one/two down-close days
- Probabilities of an up-/down-close day following one/two up-close days.
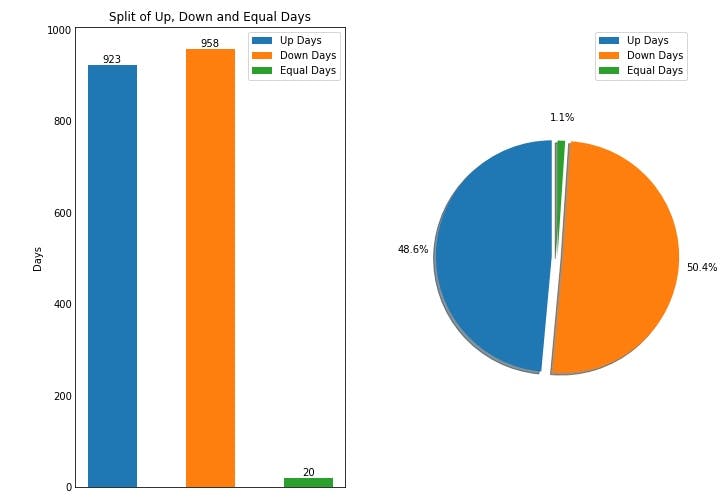
Starting with the split of Up, Down and Equal days, which is presented in the figure below, we can see, that the percentages of Up and Down days are in line with the random-walk theory, where we would expect a pretty equal amount of Up and Down days. Here this is the case, as we have 923 Up days, 958 Down days and 20 Equal days in the period from May 19th 2017 to August 1st 2022. This correlates to 48.6% Up Days, 50.4% Down Days and 1.1% Equal days (the additional 0.1% is due to the rounding by matplotlib).
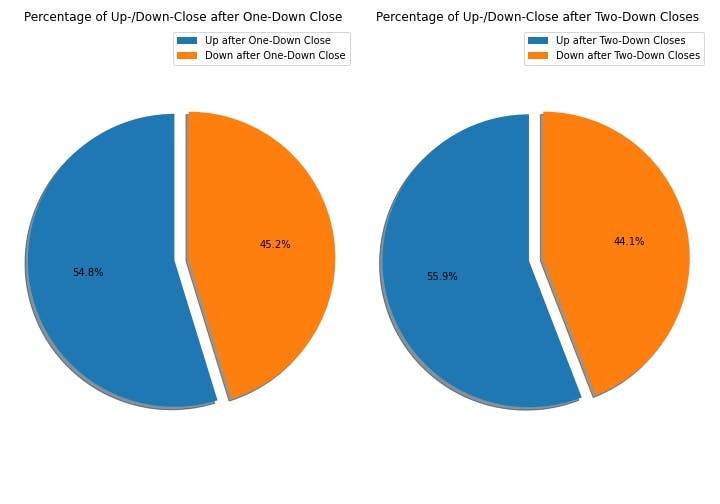
As the split of Up, Down and Equal days is in line with the random-walk theory we go to the next step, where we analyse the percentages of an up-/down-close day following one or two consecutive down-close days. The results for this are visible in the chart below and again we see a skew to the upside for days following one or two consecutive down-close days. More specifically XRP had an up-close day 54.8% of the time following one down-close day and had an up-close day 55.9% of the time following two consecutive down-close days. This tells us, that XRP favours the upside following down-close days and this favour towards one side of the market goes against the random-walk theory, where we would expect the probabilities for an up-/down-day following one/two down-days to be split near 50/50 i.e. the previous day should have no influence on the next day.
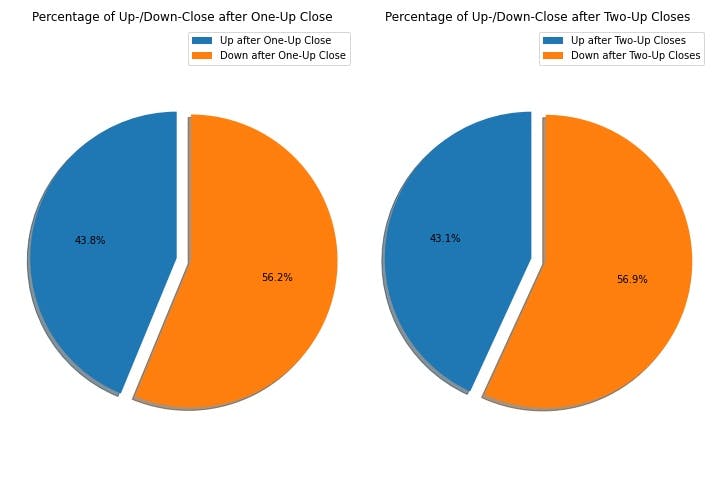
We just saw, that XRP favours the upside following down-close days and now we ask the reverse question. Does XRP favour a side following one or two up-close days? As can be seen in the chart below, it does favour a side. More specifically it favours the downside following one or two consecutive up-close days. After one up-close day a down-close day happens 56.2% of the time and after two consecutive up-close days a down-close day is even more probable at 56.9%. These results are quite interesting, as XRP is the first cryptocurrency, which favours both an up-close day after one/two down-close days and a down-close day after one/two up-close days with the tendency for down-close days following up-close days being slightly higher.
Conclusion
We looked at the price data of XRP from May 19th 2017 to August 1st 2022 and looked at the movement of XRP to see if there might be a favourable side of the market, or if XRP's movement is truly random. Equally as for ETH and LTC the split of Up, Down and Equal days points towards random movement and XRP following the random-walk theory. This changes as soon as we look at the probabilities for up- and down-close days following one or two down-close days and one or two up-close days. Interestingly XRP shows a tendency to move against the previous days direction. To me this points to XRP not necessarily being a too trendy cryptocurrency in relation to its market movement, as it favours both sides. For me this favour for both sides could indicate a tendency to range.