Photo by DrawKit Illustrations on Unsplash
Crypto Market Analysis - Is the Market random or is there a favourable Side - Ethereum (ETH)?
This series deals with the question if the crypto markets follow the random-walk theory, or if the markets have a favourable side. More specifically we look at the data to find out, if there is a favourable side of the market i.e. if it is favourable to be on the long/short side for different cryptocurrencies. The analysis focuses on daily price data and we just look at the relation of up-/down-close candles.
The cryptocurrency I focus on in this article is Ethereum (ETH). Be wary to take this analysis with a grain of salt, as the data available might not be enough to extract actual valid information from the data. Further this must not be seen as financial advice.
Data Acquisition
Equally to the previous article, where I focused on Bitcoin, I again used the Gate.io Exchange API to query the price data. See this article to find out more about how to get the price data and which exchanges are supported by the ccxt library. For Ethereum price data is available all the way back to March 9th 2016. This means on the day this analysis is based (August 1st 2022), we have 2337 days of data available (March 9th 2016 - August 1st 2022).
Findings
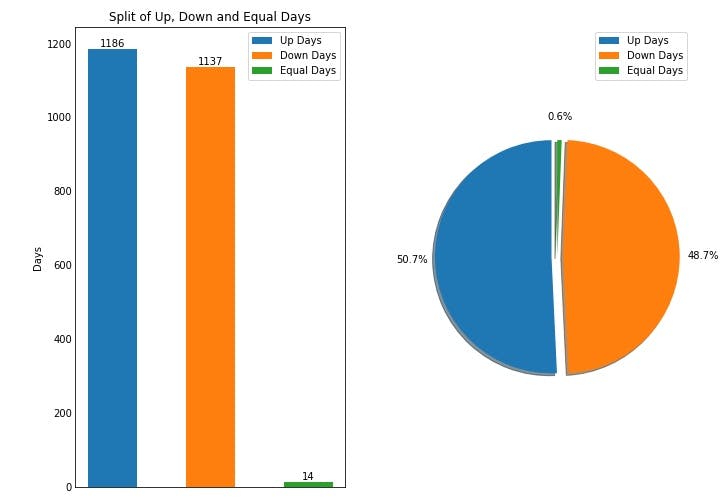
Regarding the analysis if ETH follows the random-walk theory or not we proceed in the same way as we did for BTC. First we look at the split of Up, Down and Equal days, to see if there is a disparity in the percentages for each category. Looking at the chart below, we can see that for ETH we have roughly the same amount of up-close and down-close days, which differently to BTC supports the random-walk theory. More specifically we have 1186 up days (50.7%), 1137 down days (48.7%) and the remaining 14 days (0.6%) were equal days. Equal days are days, where the open price is equal to the closing price, so on a daily basis price did not move.
The split of 50.7% up-close and 48.7% down-close days is what I would still categorize as random, as the divergence from 50% is less than 2% for both types (up-close & down-close). To me a divergence of more than 2% from 50% would be too much to be called random over this amount of data, but this is just a personal opinion.

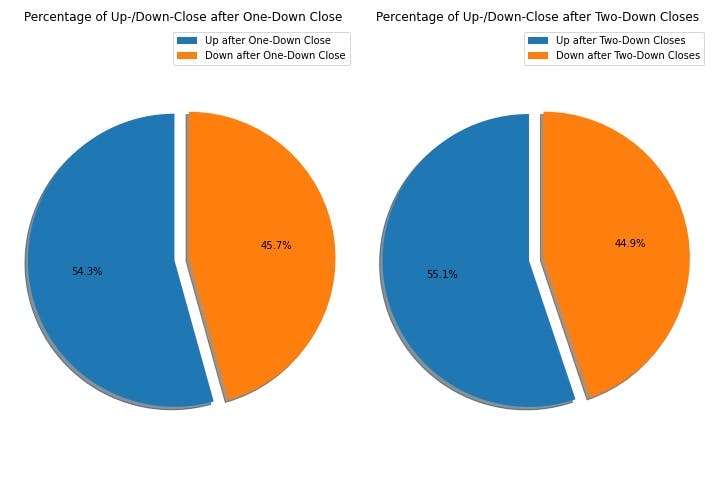
As the split of Up, Down and Equal days does conform with the random-walk theory we again look at the percentages of an up-/down-close day following one and two down-close days to see if ETH really follows the random-walk theory or if there is a favourable side. As for BTC we need price to not be influenced by the movement of the previous day to be really random i.e. after a down-closing day the probability for an up-close/down-close day should each be close to 50%. The results of the analysis are presented in the figure below and as can be seen ETH had an up-close day 54.3% of the time following one down-close day and it had an up-close day 55.1% of the time following two consecutive down-close days. This is very close to the results we got for BTC and indicates a non-random price movement for ETH.

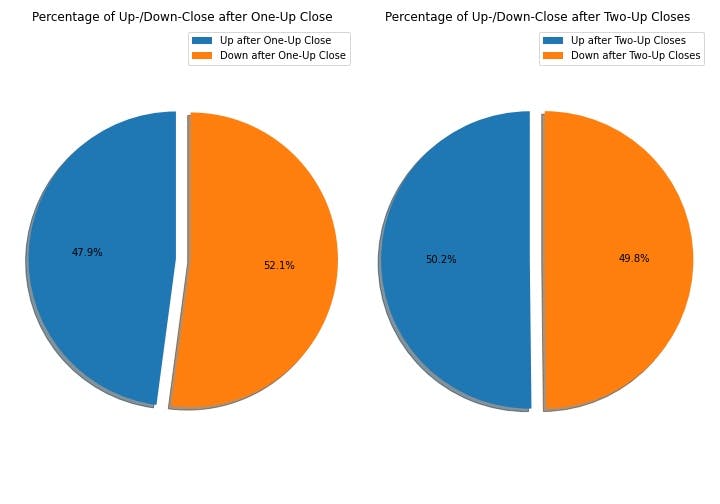
So far our results for ETH are quite equal to the ones we got for BTC and as we did for BTC we now also take a look at what happens to the probabilities of up-/down-close days after one and two consecutive up-close days. Not too surprising are the results shown below, which are similar to BTC. As for BTC the probabilities for an up-/down-close day following one/two up-close day(s) are quite equally split for ETH, with the percentages for a down day after one up day being skewed slightly to the downside. This slight skew is interesting, but not too informative, as it is just around the 2% displacement from 50%. Even though the displacement is just above 2% we cannot simply neglect it and can analyze what it might indicate. Combining the results for ETH we can make a case for ETH's movement being overall non-random and slightly favouring the long side, but the movement seems to be more random than BTC's. This conclusion is drawn from the facts, that
- for ETH the split of Up, Down and Equal days is not skewed to the up-side as it is for BTC
- for ETH the percentages of an up-/down-close day following one and two down-close days are about 1% less skewed to the upside than they are for BTC
- ETH shows a slight skew to the down-side following one up-close day opposed to the random movement of BTC following an up-close day.
Please keep in mind, that these differences between ETH and BTC might be caused by BTC being a more mature cryptocurrency with nearly 3 years more price data.

Conclusion
We looked at the price data of ETH from March 9th 2016 to August 1st 2022 and looked at the movement of ETH to see if there might be a favourable side of the market, or if ETH's movement is truly random. Equally as for BTC, the probabilities of an up-/down-close day following one and two down-close days point to a non-random movement and a skew of the probabilities to the long side. On the other hand the split of Up, Down and Equal days shows random movement for ETH and the probabilities of an up-/down-close day following one and two up-close days show random movement for the day following two up-close days and show a skew to the downside following one up-close day. As stated earlier this suggests, that ETH's movement is more random than BTC's, but again for ETH to have really random movement the previous days movement should have no impact on the next days movement, which is not the case.
So in conclusion for me the percentages of an up-/down-close day following one and two down-close days point to the long side being also the favourable side for ETH, while keeping in mind that ETH tends to a more random movement than BTC. In general to me this suggests random price movement for ETH as long as the trend is upwards, with the upwards-trend being not as reliable as for BTC.

